Quick Start & Onboarding
Welcome to the Vaticy platform 🎉
This page should help you get started with the Vaticy platform!
First Login
We will start with heading to Vaticy platform and logging-in using the received credentials.
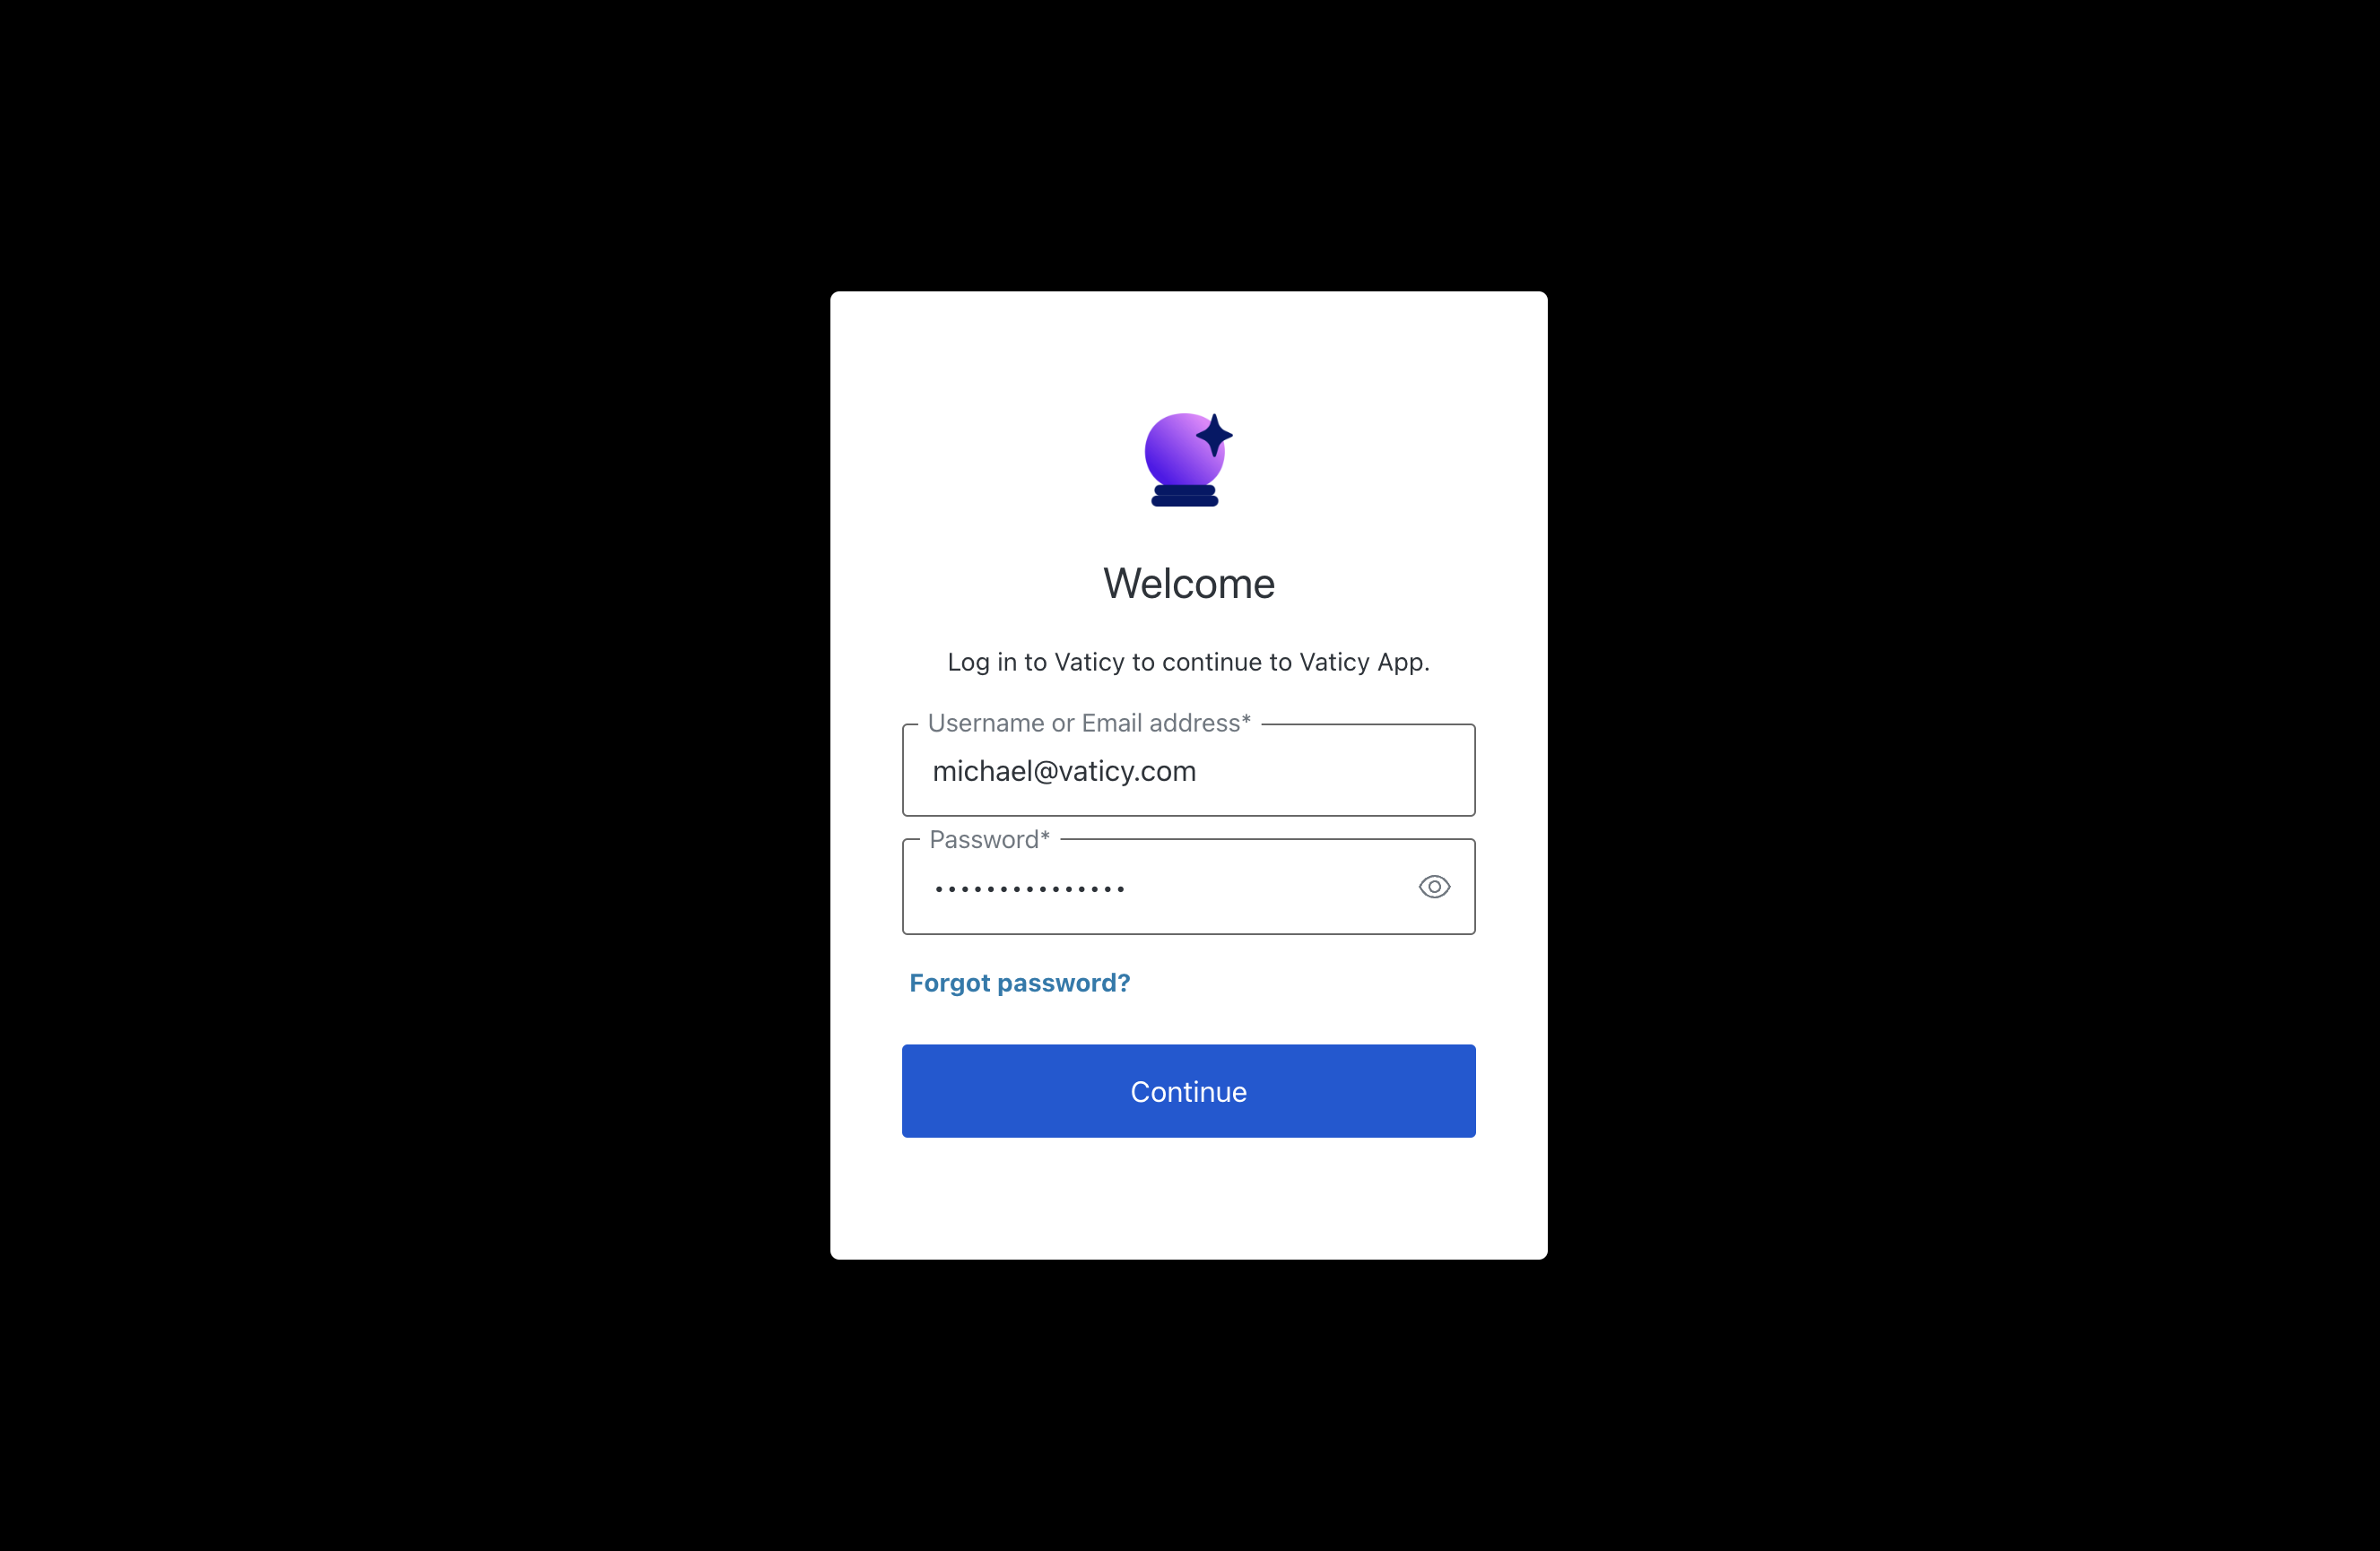
If you have any problem with authenticating please contact the Vaticy team.
Home page
The home page will contain a Performance Dashboard for you to see some analytics about past incidents.
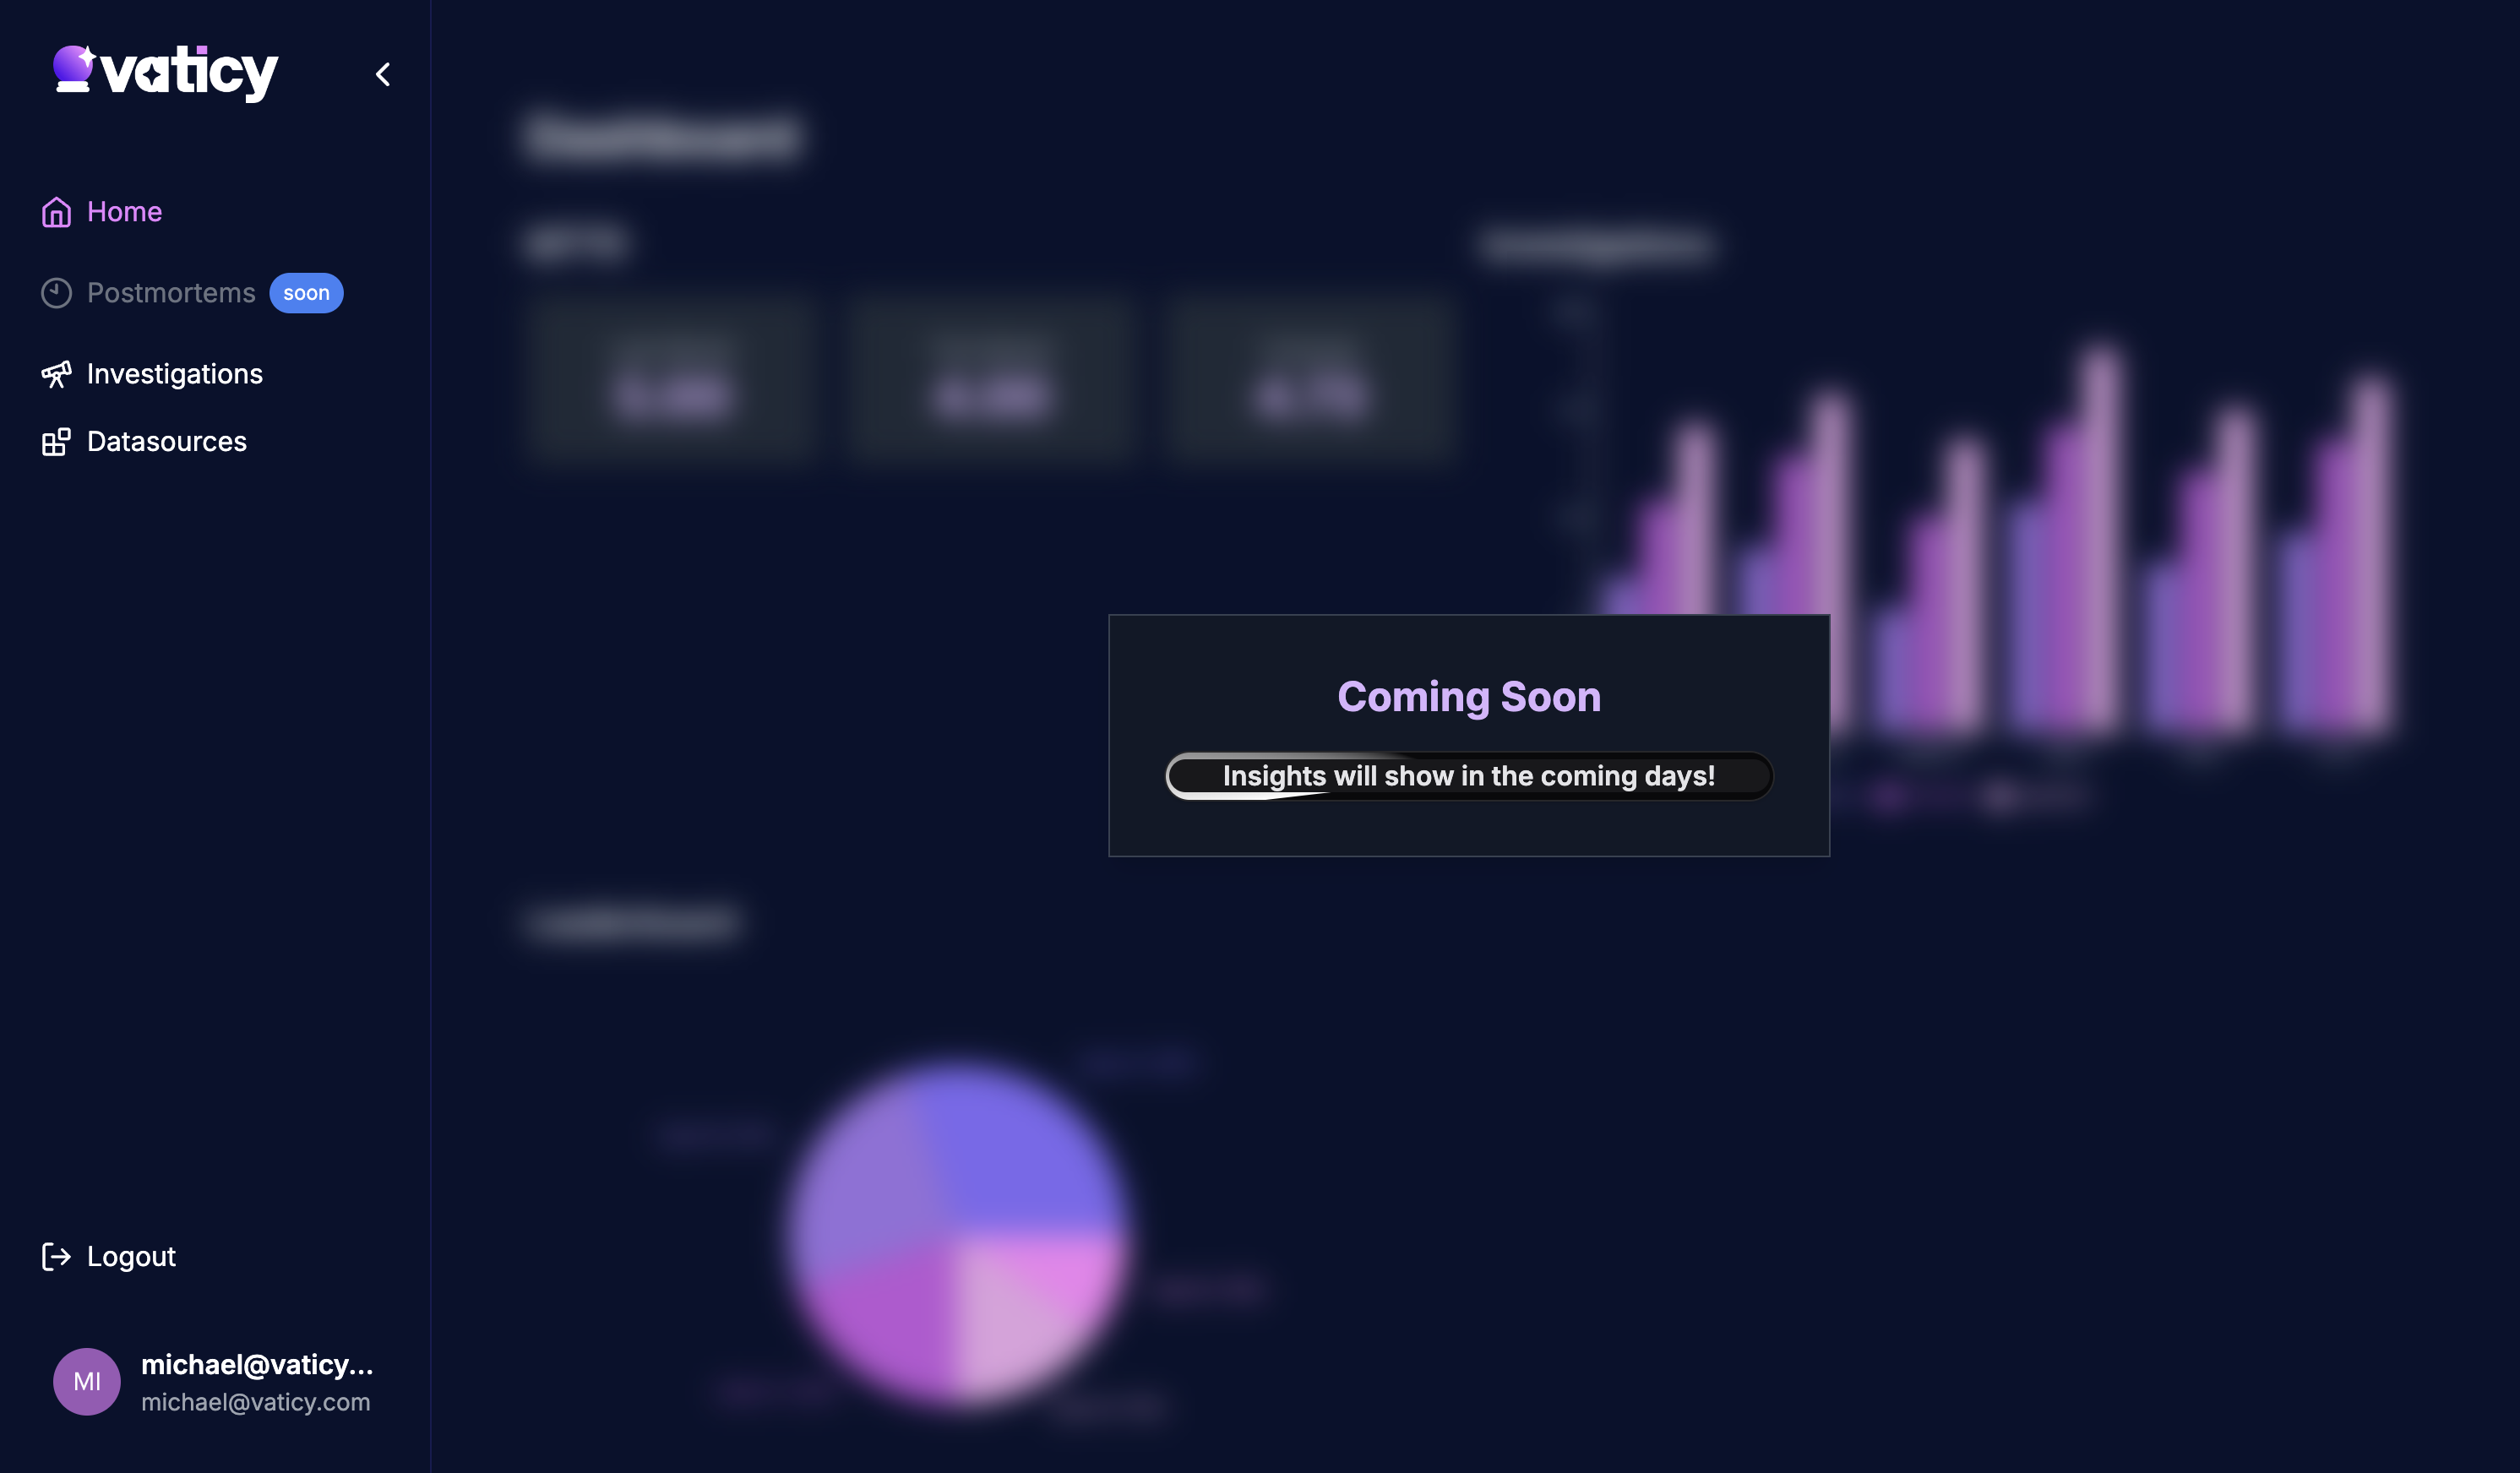
The 🏠Home page will be available in the future.
Configuring datasources
Deploying the Kubernetes agent
To complete the onboarding you should go to the 🧩Datasources page.
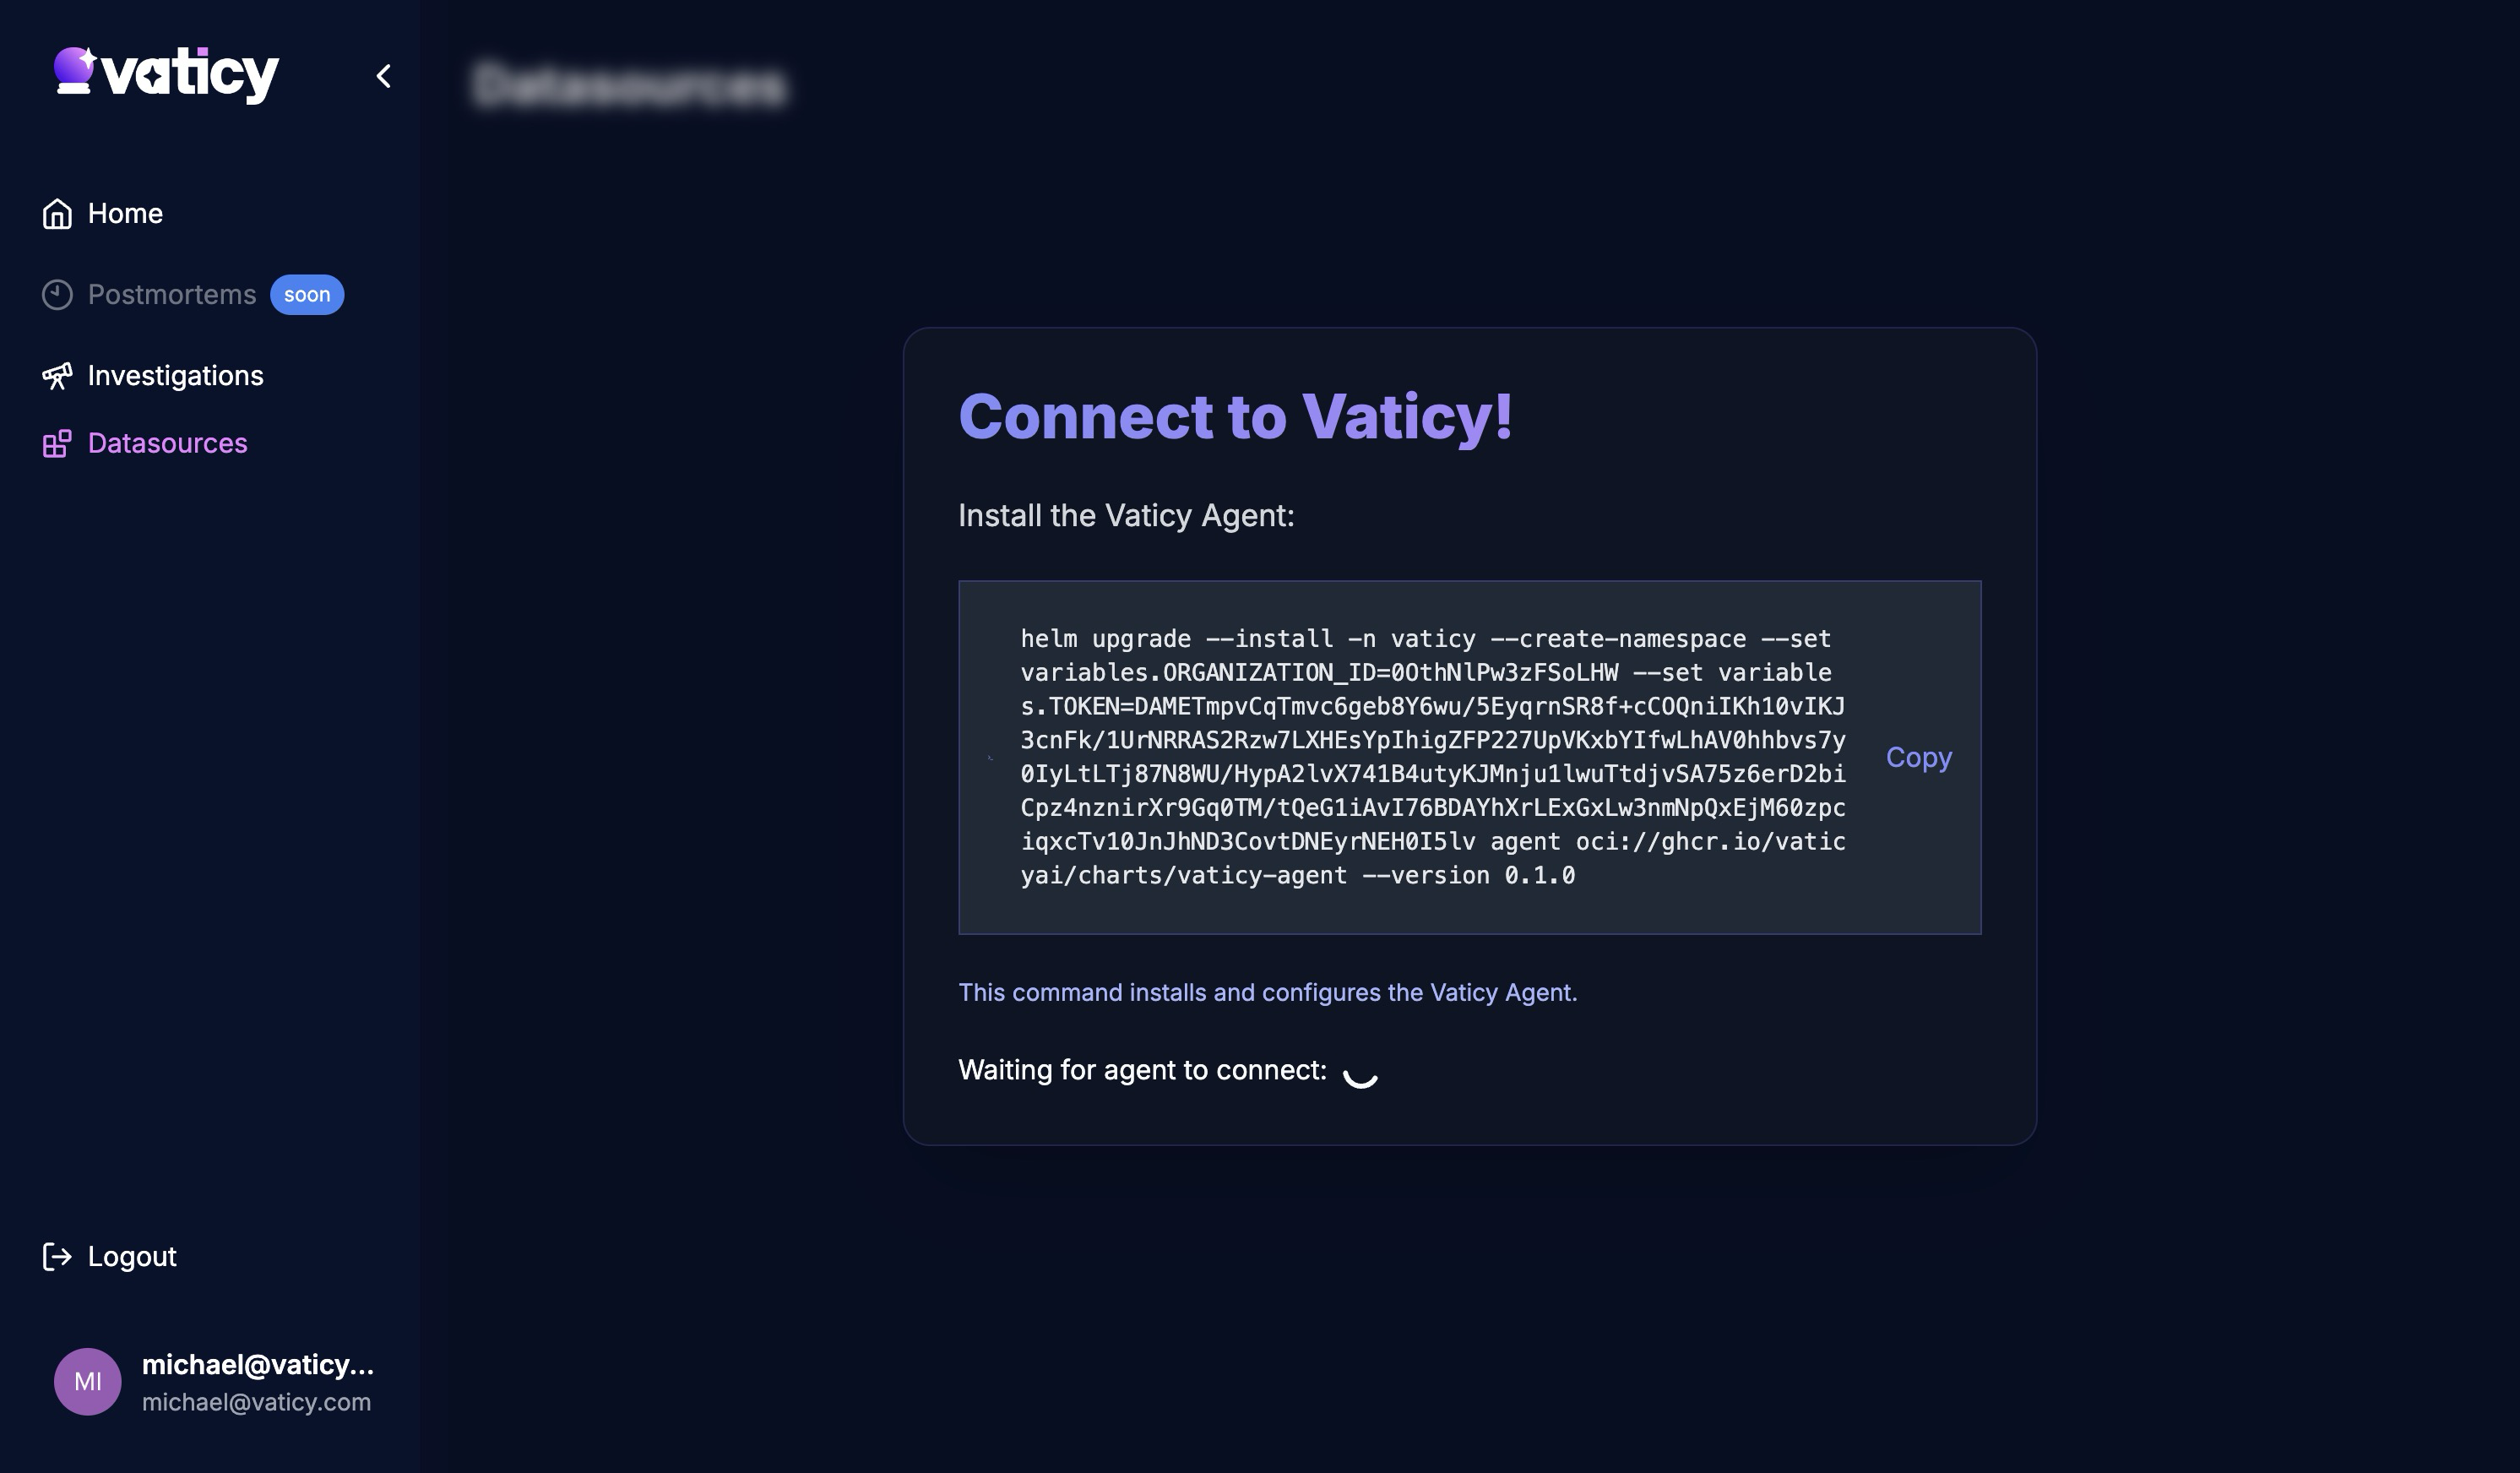
Here you can see an helm command which can execute on your Kubernetes cluster to deploy the Vaticy agent, just copy it into your terminal and press Enter!
When the Vaticy platform celebrates, it means the new agent is connected:
Connecting the agent to Prometheus
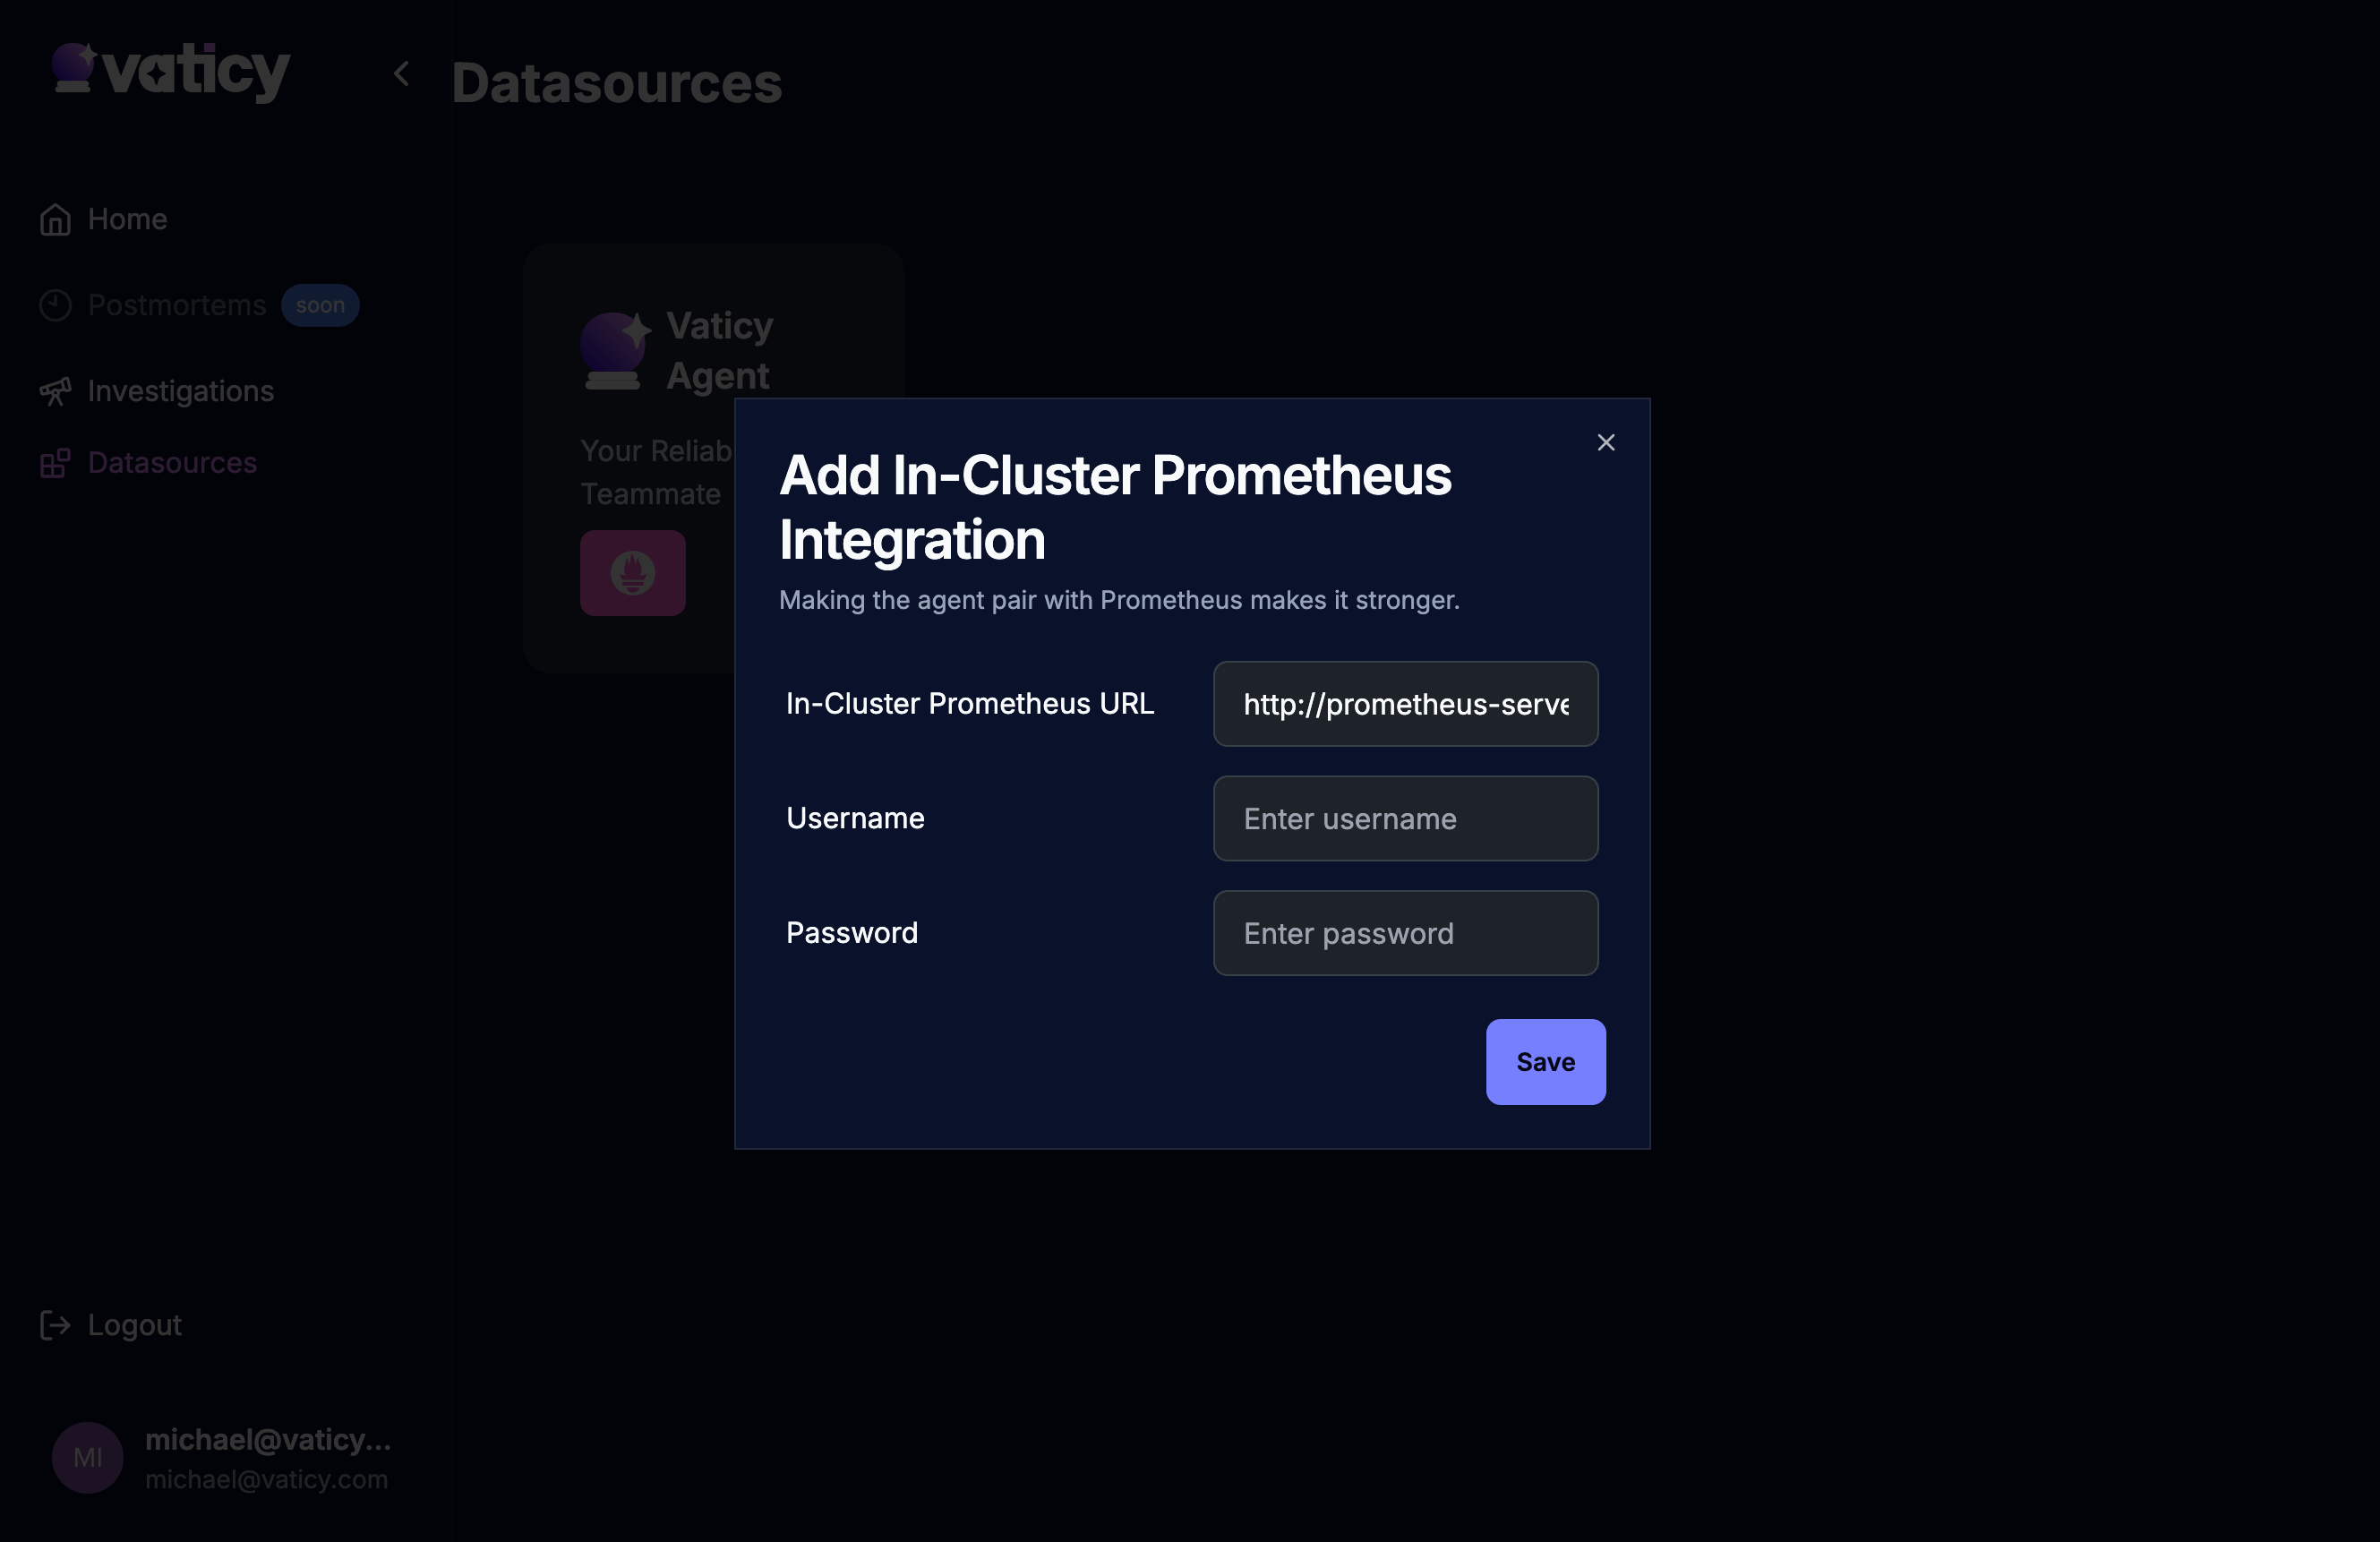
Inside the agent, click on the Prometheus logo to open a configuration pop-up.
Please input the following:
- In-cluster Prometheus
url- Provide a full KubernetesServicename like:http://prometheus-server.monitoring.svc.cluster.local:80 - Username - If needed for authentication
- Password - If needed for authentication
Press the Save button and close the pop-up.
This will allow the Vaticy Agent to fetch specific needed metrics while its investigating the cluster for clues.
Investigations page
In the investigation page you will be able to see each firing alert (currently only from Prometheus) on the top right of the page.
Clicking on a specific alert will initiate an investigation:
Chat
The chat on the right side is used Vaticy to communicate details about the investigation.
It is possible to ask questions and details about the investigation.
Note: The chat works only when there is an on-going
investigationsession!
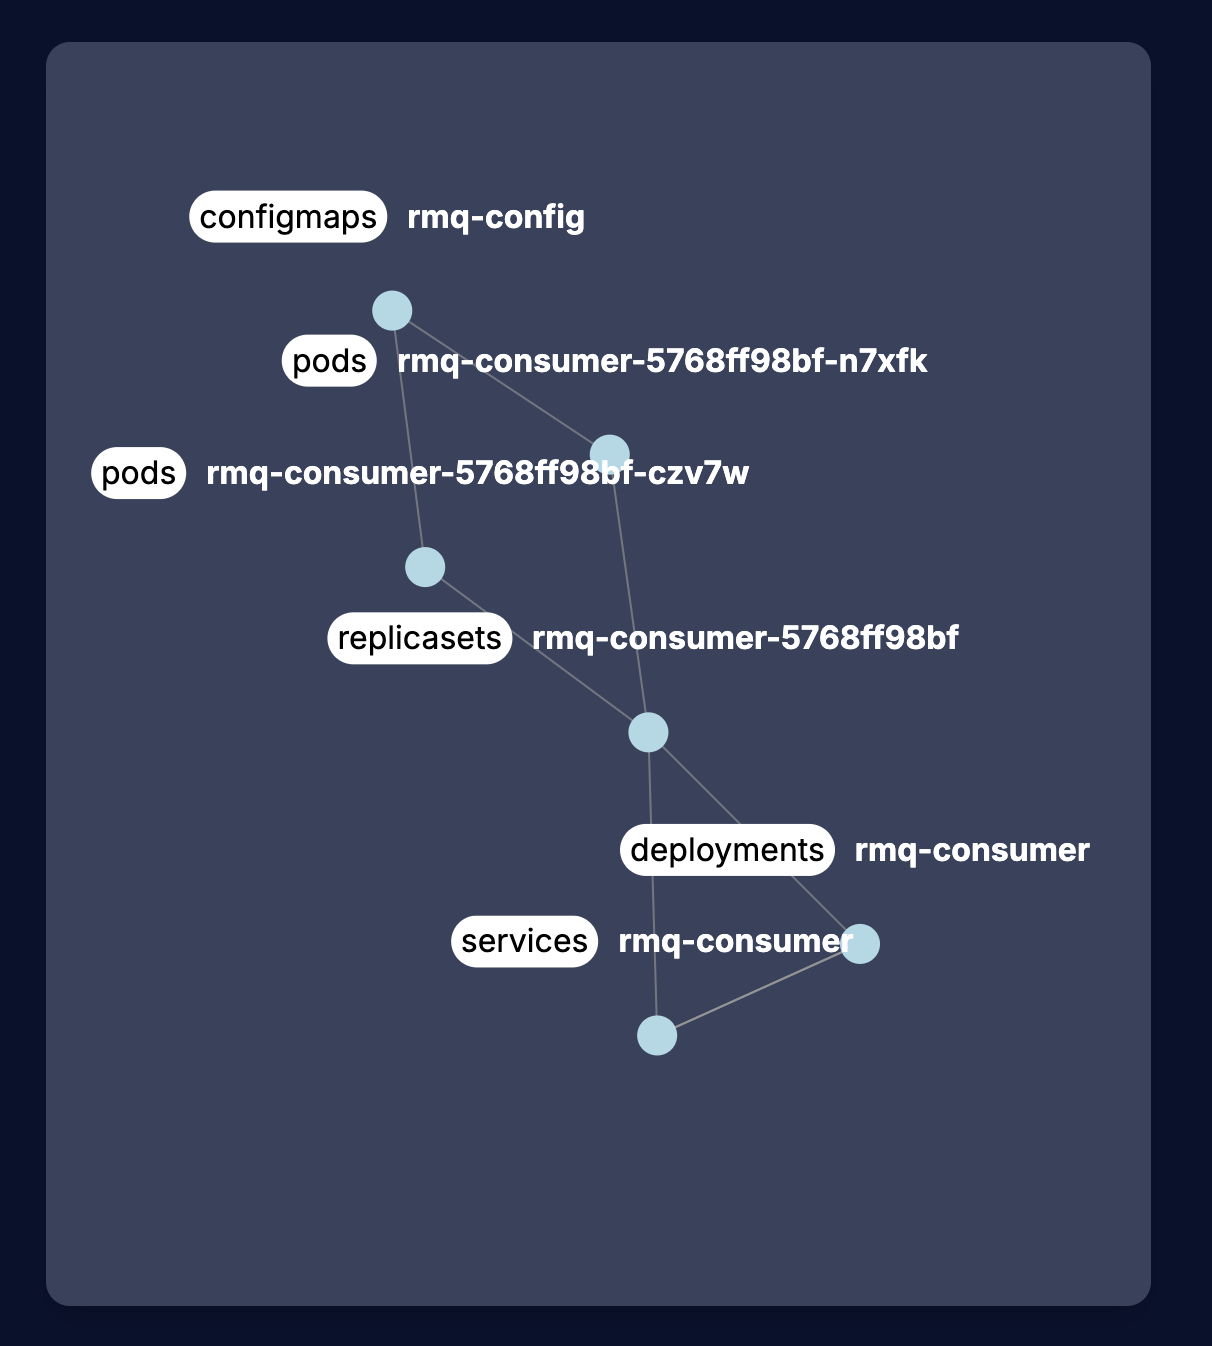
Evidence Graph
This graph contains the connections of Kubernetes objects deemed related to the incident:
Other get started guides and documentations
Refer to any of the following getting started guides, as necessary.